Prometheus
Щоб збирати метрики роботи Casdoor, такі як пропускна здатність API, затримка API, використання ЦП, використання пам'яті та інше, вам потрібно налаштувати ваш профіль Prometheus.
global:
  scrape_interval: 10s # The time interval for fetching metrics

scrape_configs:
  - job_name: 'prometheus'
    static_configs:
      - targets: ['localhost:9090']
  - job_name: 'casdoor' # Name of the application to be monitored
    static_configs:
      - targets: ['localhost:8000'] # Back-end address of Casdoor deployment
    metrics_path: '/api/metrics' # Path for collecting indicators
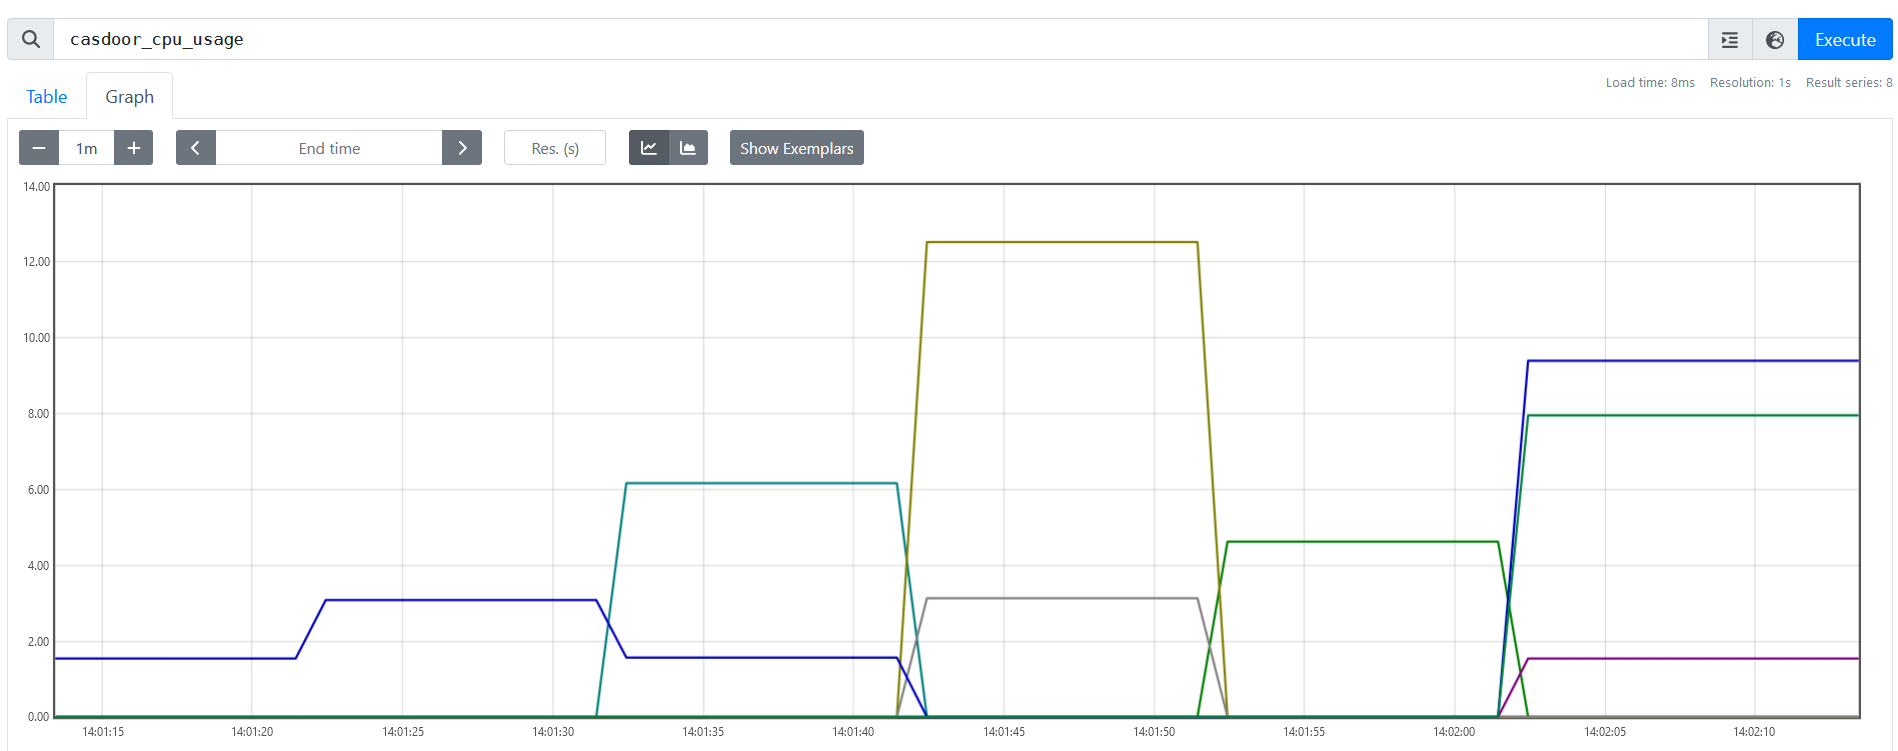
Після успішного налаштування ви знайдете наступну інформацію в Prometheus: