Prometheus
เพื่อเก็บเมตริกการทำงานของ Casdoor เช่น ปริมาณการใช้งาน API, ความล่าช้าของ API, การใช้ CPU, การใช้หน่วยความจำ และอื่นๆ คุณต้องกำหนดค่าโปรไฟล์ Prometheus ของคุณ
global:
  scrape_interval: 10s # The time interval for fetching metrics

scrape_configs:
  - job_name: 'prometheus'
    static_configs:
      - targets: ['localhost:9090']
  - job_name: 'casdoor' # Name of the application to be monitored
    static_configs:
      - targets: ['localhost:8000'] # Back-end address of Casdoor deployment
    metrics_path: '/api/metrics' # Path for collecting indicators
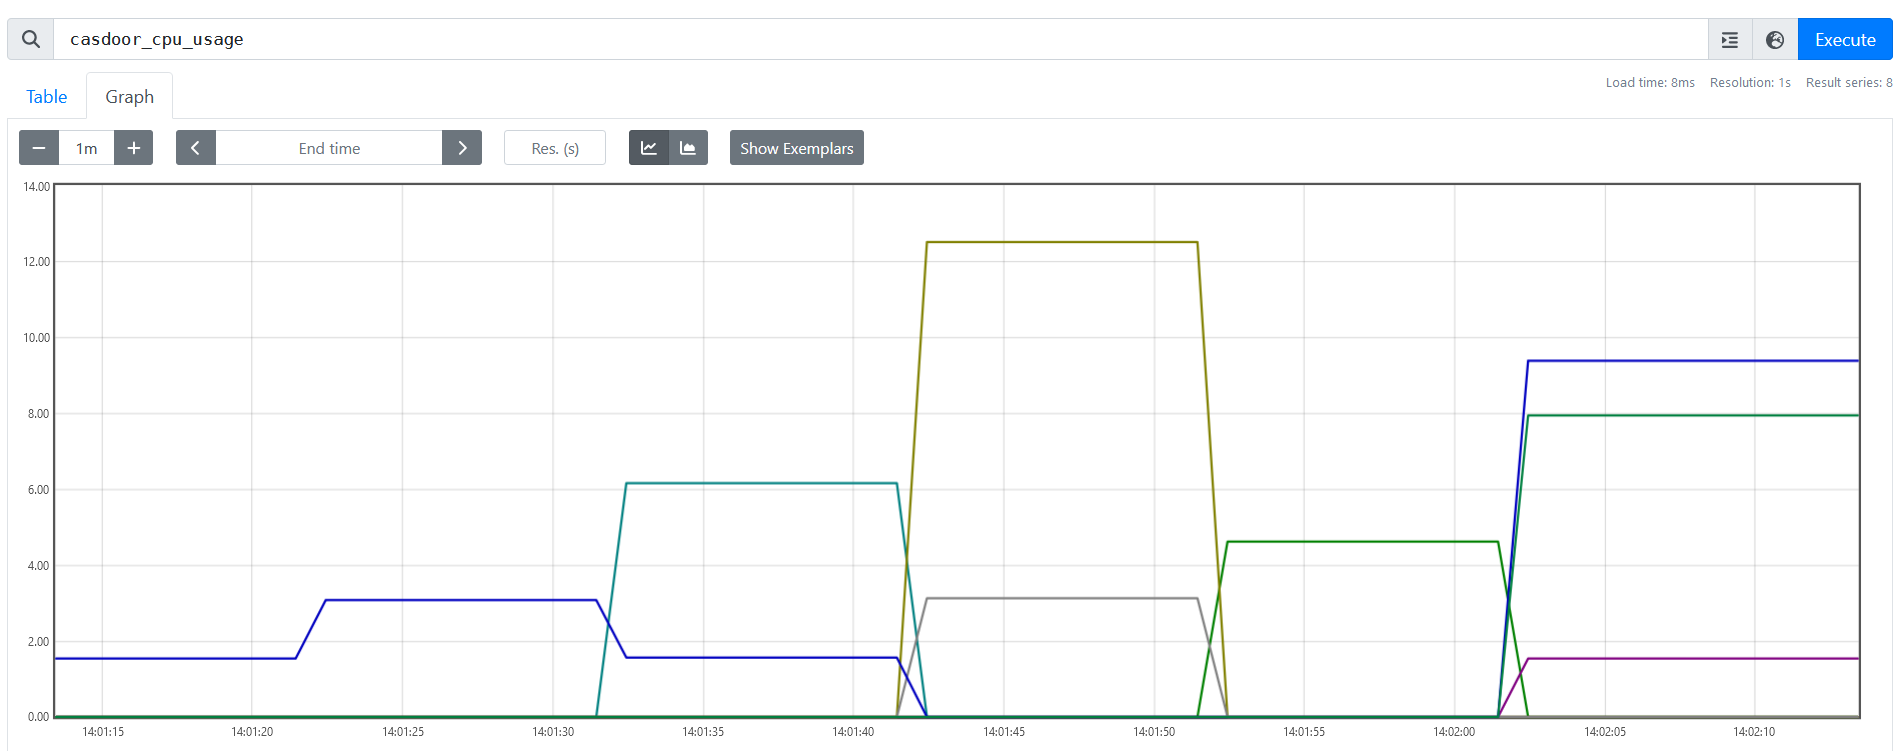
หลังจากการกำหนดค่าที่สำเร็จ คุณจะพบข้อมูลต่อไปนี้ใน Prometheus: